Payment analytics
The Analytics section contains tools that allow you to view important payment metrics and analytics for your transactions.
Defining the scope of analytical data
За допомогою блоку фільтрації ви можете обрати період (за замовчуванням показана інформація за поточний тиждень), валюту, платіжні проєкти, а також платіжні атрибути за якими буде відображена аналітика.
Using the filter section, you can choose the period (by default, information for the current week is displayed), currency, payment projects, and payment attributes for which analytics will be displayed. The selectable list of projects depends on the selected currency and displays all live projects that support the respective currency. When working with a large number of projects, you can use a partial match search in the project list.
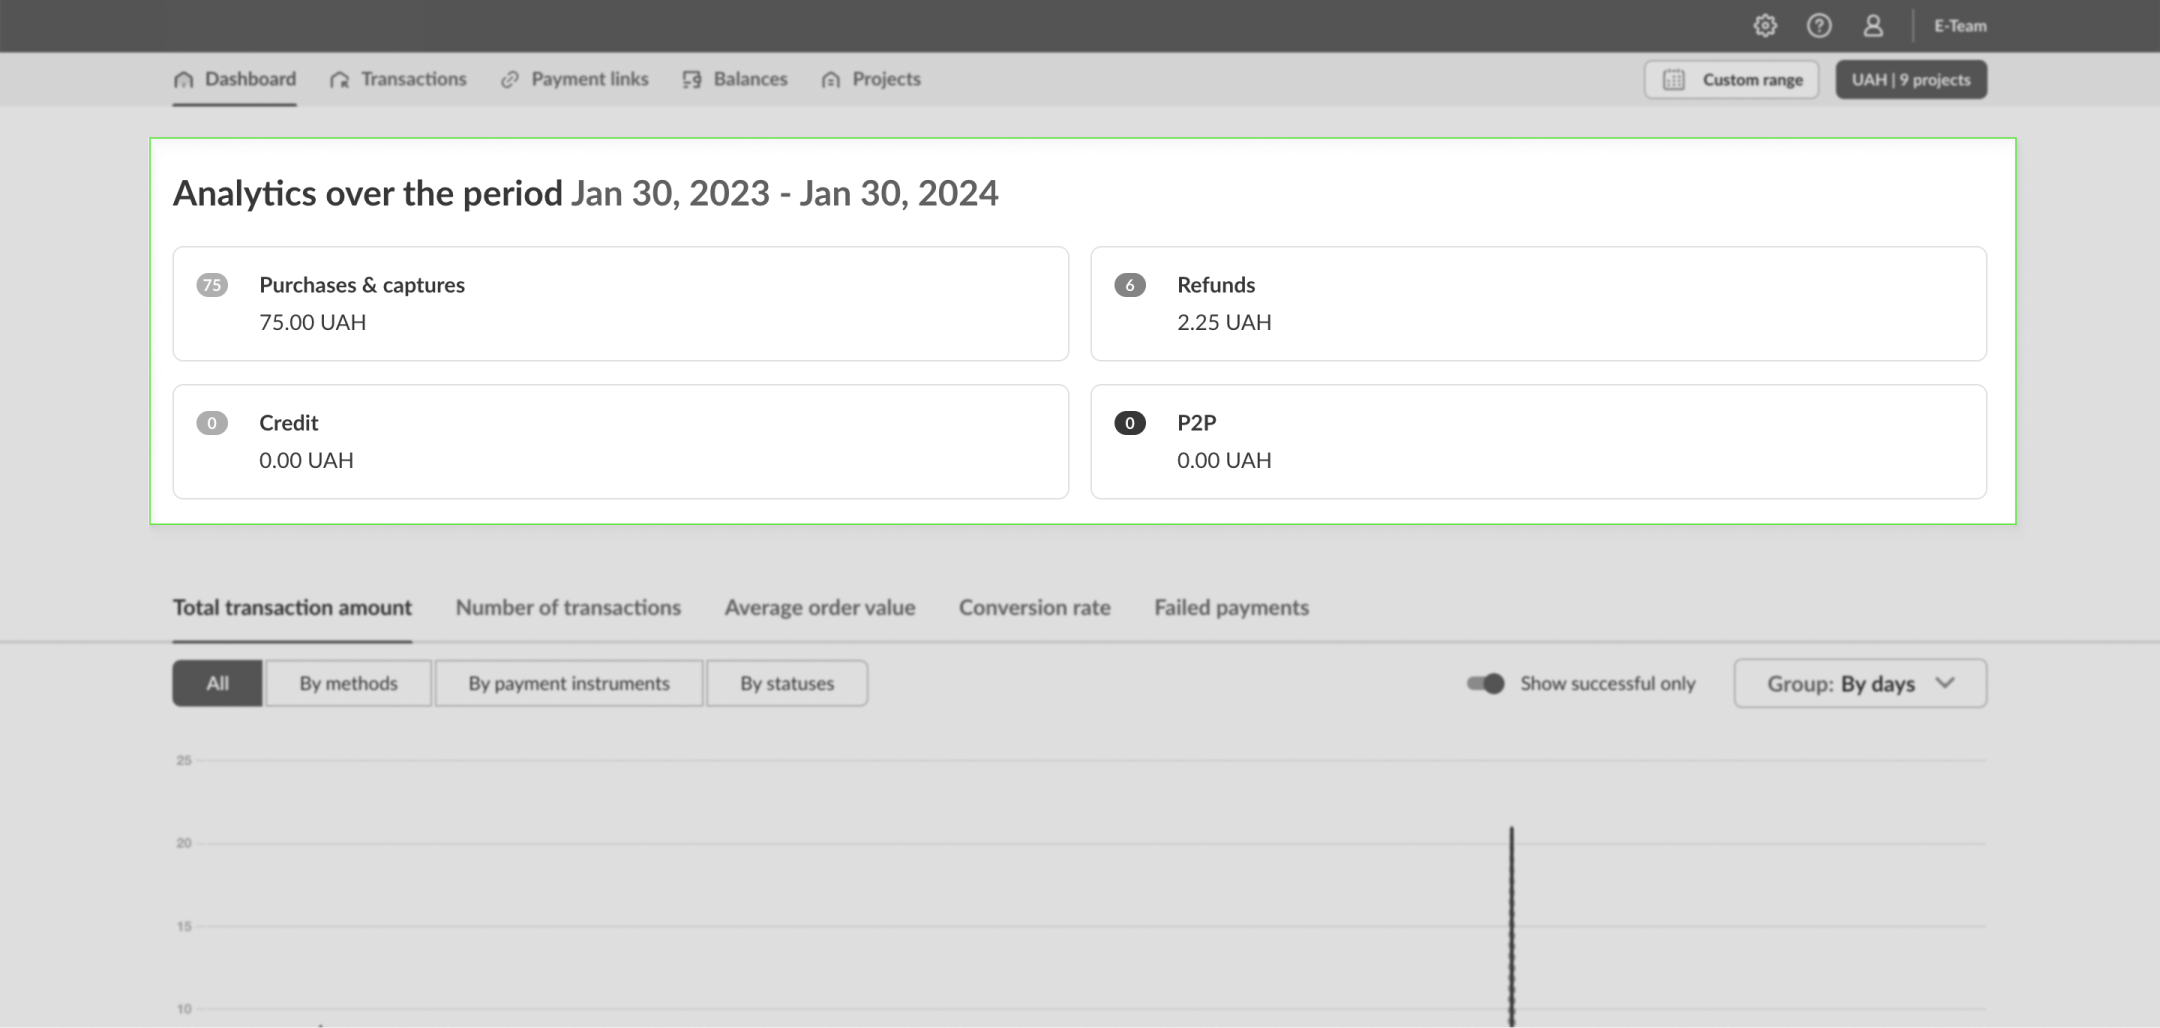
Statistics on successful payments
The central section of the page displays data on successful transactions of the following types:
The statistics reflect the total number and amount of payments for each specified type, based on the parameters selected in the filter section.
Charts and metrics
The section with charts allows you to view the following information presets, which can be selected through the corresponding tabs above the chart:
- Total amount of transactions This tab displays information about the total amount of transactions of all types for the selected period. You can view the total amount (“All”) or amounts distributed by transaction methods (“By methods”), payment instruments (“By payment instruments”), by statuses (“By statuses”).
- Number of transactions This tab provides information about the total number of transactions for the selected period. You can view the total number of transactions or amounts distributed by transaction methods (“By methods”), payment instruments (“By payment instruments”), by statuses (“By statuses”).
- Average order value This tab shows the arithmetic average amount of your orders for the selected period. You can view average checks by a specific payment methods (“By payment instruments”).
- Conversion This tab displays the conversion rate of transactions for the selected period. Conversion rates can be calculated using the following approaches:
Aggregated approach: counts all unsuccessful payments using the same payment card as one attempt, to exclude cases where the same payer makes multiple unsuccessful attempts. This approach helps identify unique problem payments.
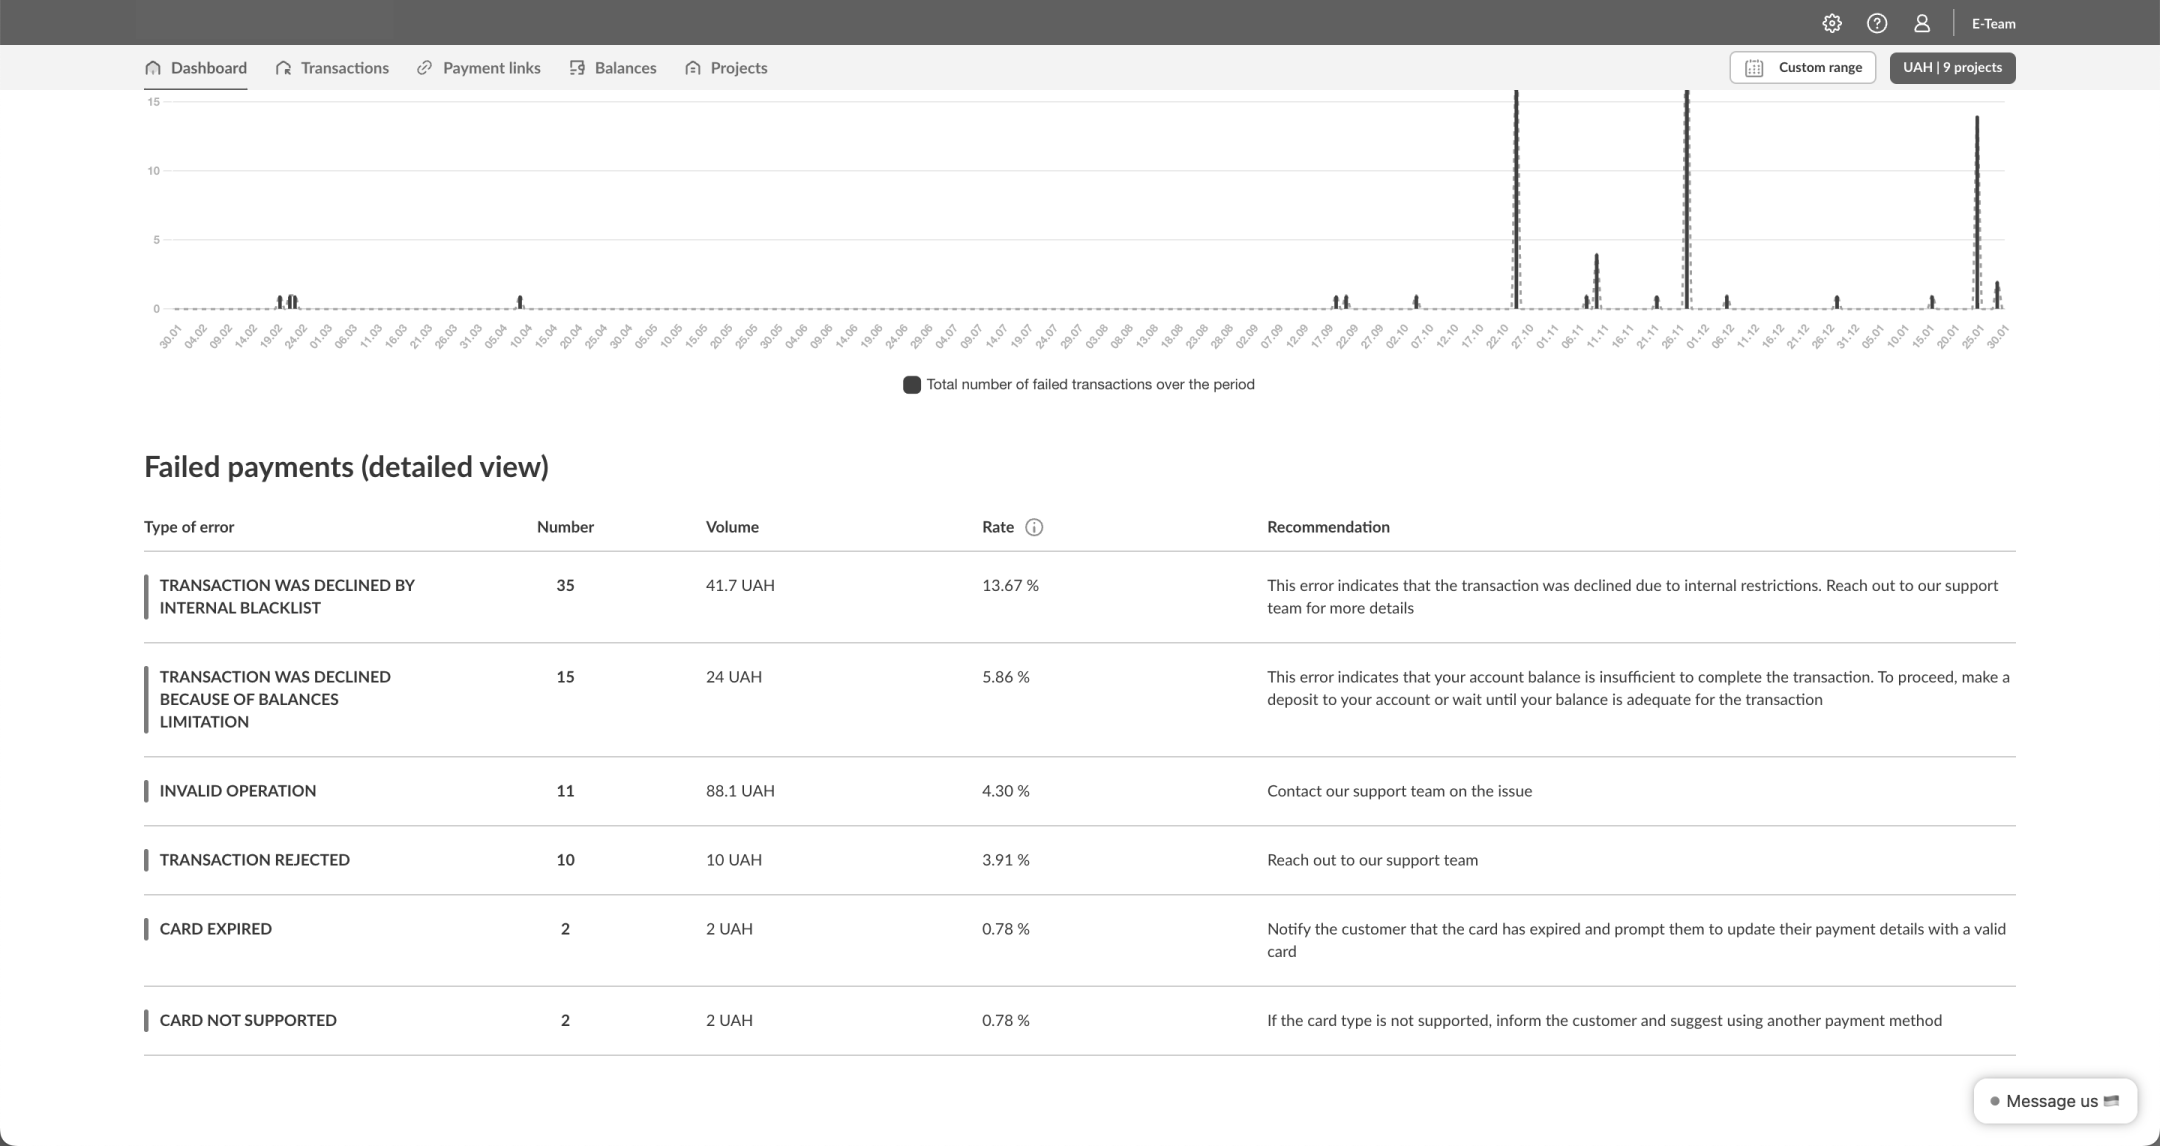
Event approach: a simple ratio of the total number of payments to the number of successful payments. - Failed payments This tab provides information about the types of errors during transactions, including the number and amount of unsuccessful transactions. It also offers breakdowns for each type of error, showing the number of transactions and amounts with that type of error, their number relative to the total transactions, and recommendations for resolution.
You can filter the information on the chart to display only successful transactions by using the corresponding switch.
Please note that you can control the display of information on the chart in several ways: group data by time intervals (timeframes) or move and scale the chart by using the Shift key and the mouse wheel.
When viewing information in terms of payment methods (instruments), the main chart displays information on the four most common payment methods used by your payers during the relevant period. However, you can see all payment methods in the pie chart below.
If a non-standard value of the payway parameter was passed in the request when making a payment, the payment method will be undefined for such transactions.